In this post in my series on pure shift NMR experiments, I’m going to finish my look into the Zangger-Sterk experiment and how to get the best out of it. In my previous post, I looked at the importance of correctly setting the bandwidth of the selective pulse in getting a good pure shift spectrum. This time around, I’m going to take a look at the slice-selective gradient in the Zangger-Sterk experiment and how to adjust it for optimum sensitivity.
Another look at the Zangger-Sterk active spin refocusing (ASR) element
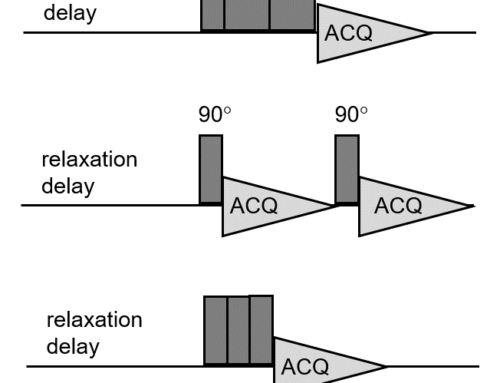
Figure 1 below shows the Zangger-Sterk active spin refocusing element.

Figure 1. Zangger-Sterk active spin refocusing (ASR) element
Last time around, we saw that setting the bandwidth of the shaped pulse too wide results in a pure shift spectrum in which peaks are not fully decoupled, while setting it too narrow results in poor sensitivity in the spectrum. The amplitude of the gradient in the ASR has a different but equally important effect on the quality of the Zangger-Sterk spectrum, as we shall see.
From band-selection to slice selection
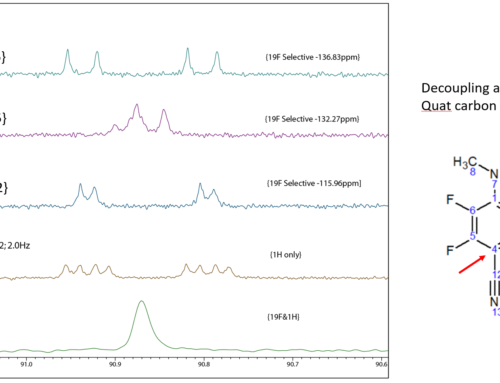
In my post on running Zangger-Sterk pure shift NMR experiments in band-selective mode, I showed how, by switching off the gradient altogether in the ASR, we convert the experiment from a slice-selective (i.e. full pure shift) experiment to a band-selective one. That’s easy to do, but how do you set the gradient amplitude optimally for slice-selective excitation? The key is to set it high enough for the ASR element to excite all the signals in the spectrum, but not much higher than that, as doing so will reduce the signal intensities. Figure 2 shows the effect of increasing the gradient in the ASR element on the excitation of signals in the 1H spectrum of 2-ethyl-1-indanone, collected on a JEOL ECZ400 spectrometer equipped with a ROYAL-HFX probe. The transmitter was set to 4.5 ppm, where there is no signal in the spectrum.

Figure 2. Effect of increasing the gradient amplitude on signal excitation in the Zangger-Sterk experiment
When the gradient amplitude is too low, no signals are excited, because there are no signals at or near the transmitter frequency. However, as the gradient amplitude is increased, signals further away from the transmitter frequency are excited, until all of the signals in the spectrum are excited once the gradient amplitude is around 4 mT/m. As the gradient amplitude is increased further, no more signals appear and the signal amplitudes decline. This tells us that, to get the best sensitivity in our Zangger-Sterk experiment with this sample, we should use a gradient amplitude of around 4 mT/m. Had the signals been dispersed over a wider chemical shift range or we had placed the transmitter somewhere other than in the middle of the spectrum, we would have had to use a larger gradient to ensure all the signals are excited properly.
Automatic gradient amplitude setting
Fortunately, the Zangger-Sterk pulse program pureshift_1d_zs.jxp in Delta 6.1 sets this gradient amplitude automatically based on the user’s setting of the spectral width (x_sweep). All you need to do is set x_offset somewhere in the middle of the spectrum and set x_sweep wide enough and everything else is taken care of. Figure 3 shows the Pulse panel for the pulse pgoram. The amplitude of the gradient grad_sl_ps_amp is calculated automatically based on the value of x_sweep.

Figure 3. Pulse panel for Zangger-Sterk pulse program pureshift_1d_zs.jxp in Delta 6.1.
Example
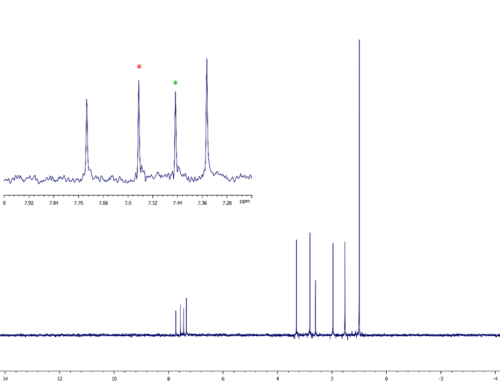
Figure 4 below shows the signal-to-noise difference between two Zangger-Sterk spectra collected on the 2-ethyl-1-indanone sample, one recorded with the default 20 ppm window (top trace) and one with a 10 ppm window (middle trace) that is more appropriate for this sample. As you can see, the noise level in the 10 ppm spectrum is around half that of the 10 ppm spectrum. The sample is rather concentrated, so all of the 2-ethyl-1-indanone signals are easy to see. However, what this example shows is that the lower noise level of the 10 ppm spectrum allows us to see some signals from impurities in the sample (red and green boxes), confirmed as real signals in the standard 1D proton spectrum (bottom trace).

Figure 4. Comparison of Zangger-Sterk pure shift spectra collected using a 20 ppm window (top) and a 10 ppm window (middle). The standard proton spectrum is shown in the bottom trace.
Conclusions
In this post, I’ve showed the effect the ASR gradient amplitude has in Zangger-Sterk pure shift NMR experiments and how it can be adjusted get optimum results. To find out more about pure shift experiments and how they can help you, let us know!
And why not try JASON software for yourself and discover how its advanced data processing and analysis tools make it easy to get great results from pure shift and many other NMR datasets.